Components of Japanese Sake
In order that they can be used as representative values, the average values for several components of Tokutei-meisho, (specifically designated sake*) and ordinary sake are respectively calculated from data taken for 5 years (2008-2012) (Table 1). From this data, the characteristics of sake are summarized below.
Alcohol content
Typically contains from 15 to 16 % alcohol.
Nihonshu-do (sake meter value)
Nihonshu-do is a specific gravity scale that provides a sweetness-dryness index for sake.
The average sake meter value is from +4 to +5.
Ekisu-bun (extract)
Ekisu-bun is defined as the weight of non-volatile components (g/100 ml).
The average extract is from 4.3 to 4.5.
San-do (acidity)
San-do is the index of organic acid content such as lactic acid, succinic acid and malic acid.
The average acidity is from 1.2 to 1.5. Acidity makes sake taste dry and rich.
In general, junmai sake*contains more acidity than others.
Amino san-do (amino acid value)
Amino san-do is the index of amino acid content. The average amino acid value is from 1.3 to 1.5. Sake with more amino acid tastes richer, while less amino acid tastes lighter.
Amakara-do and Noutan-do
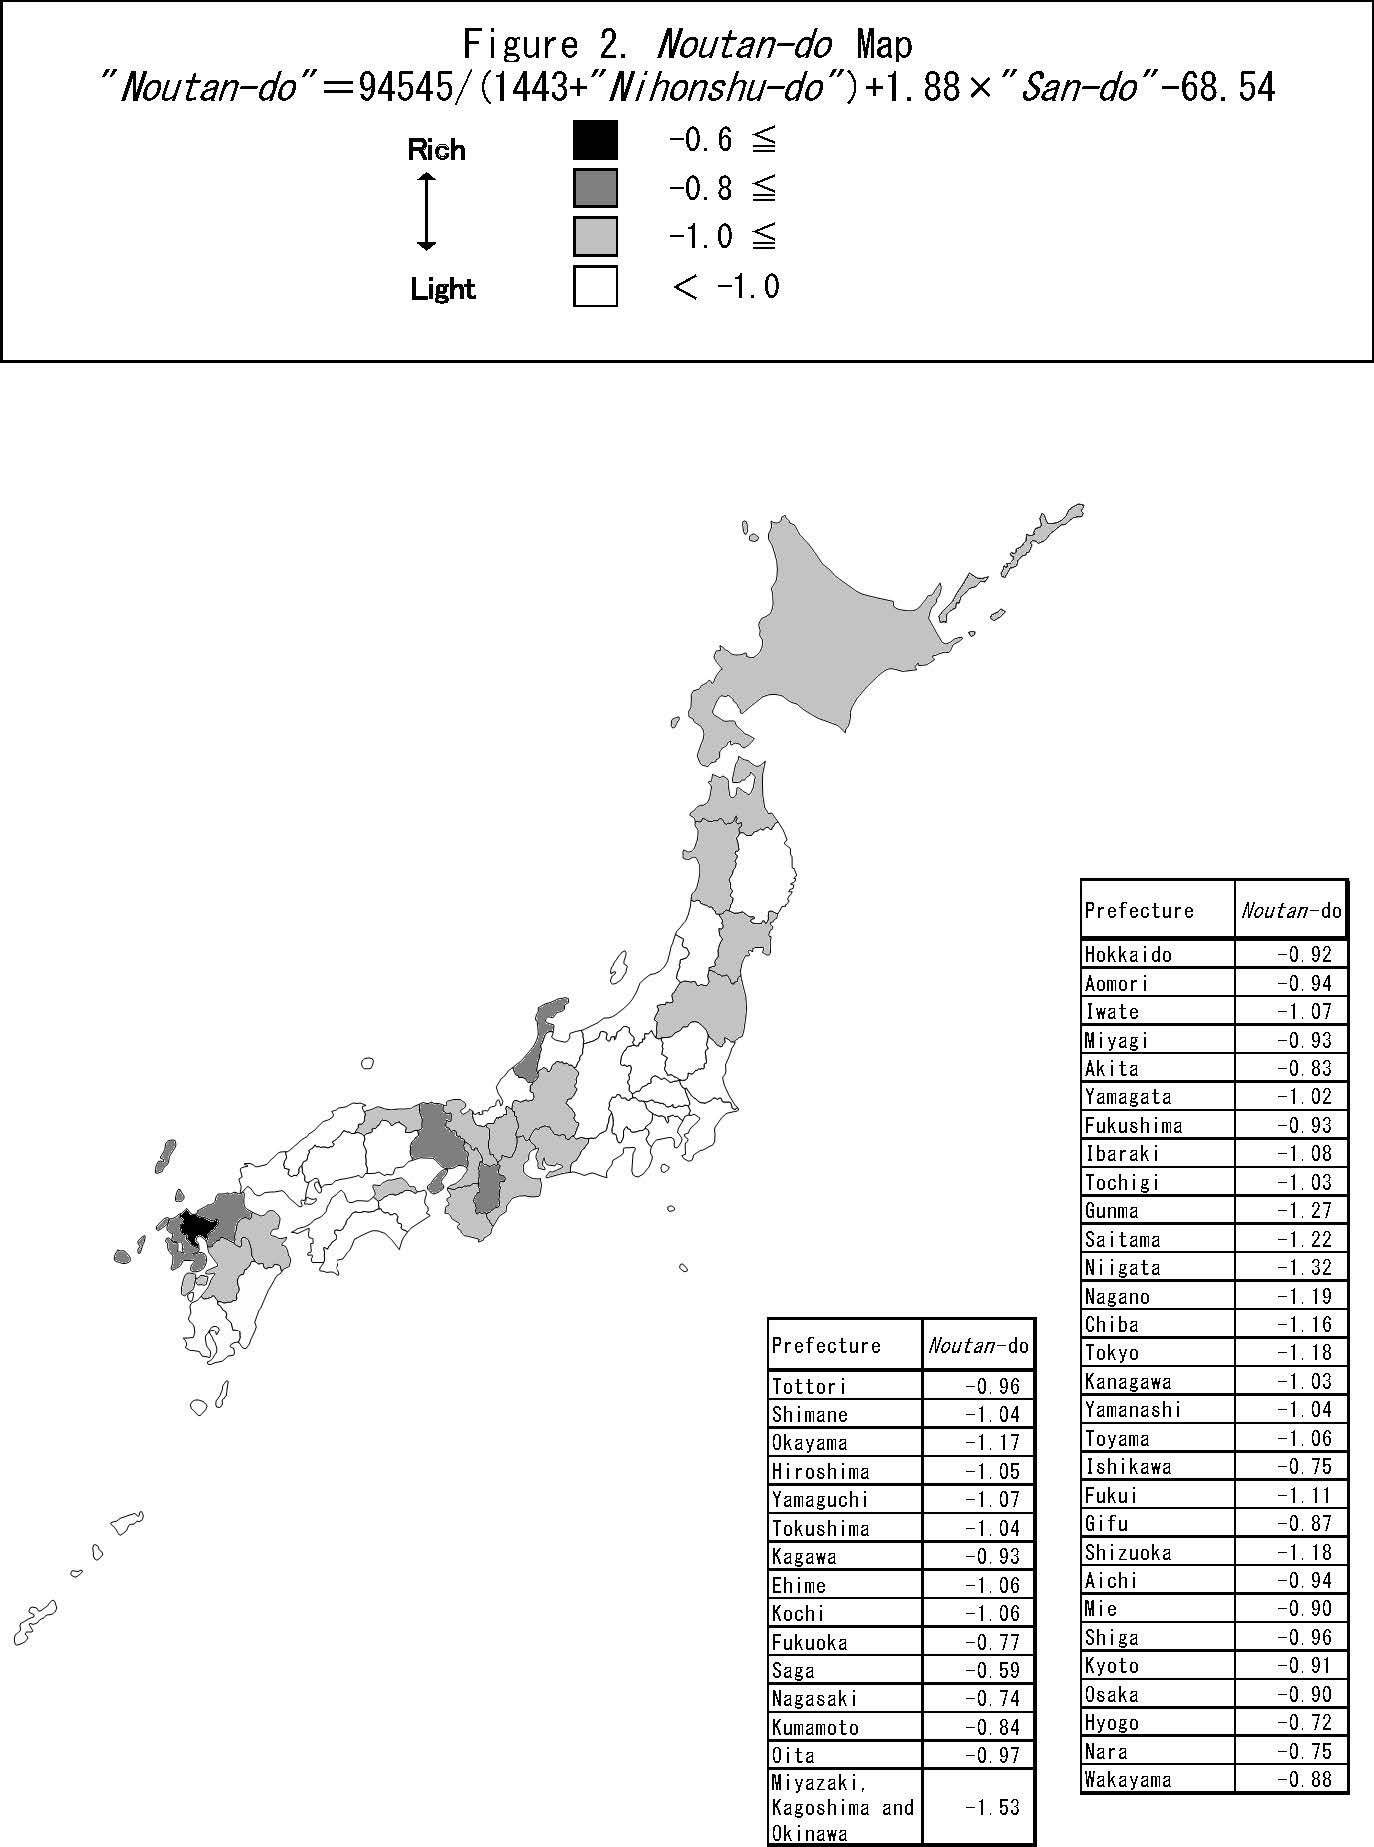
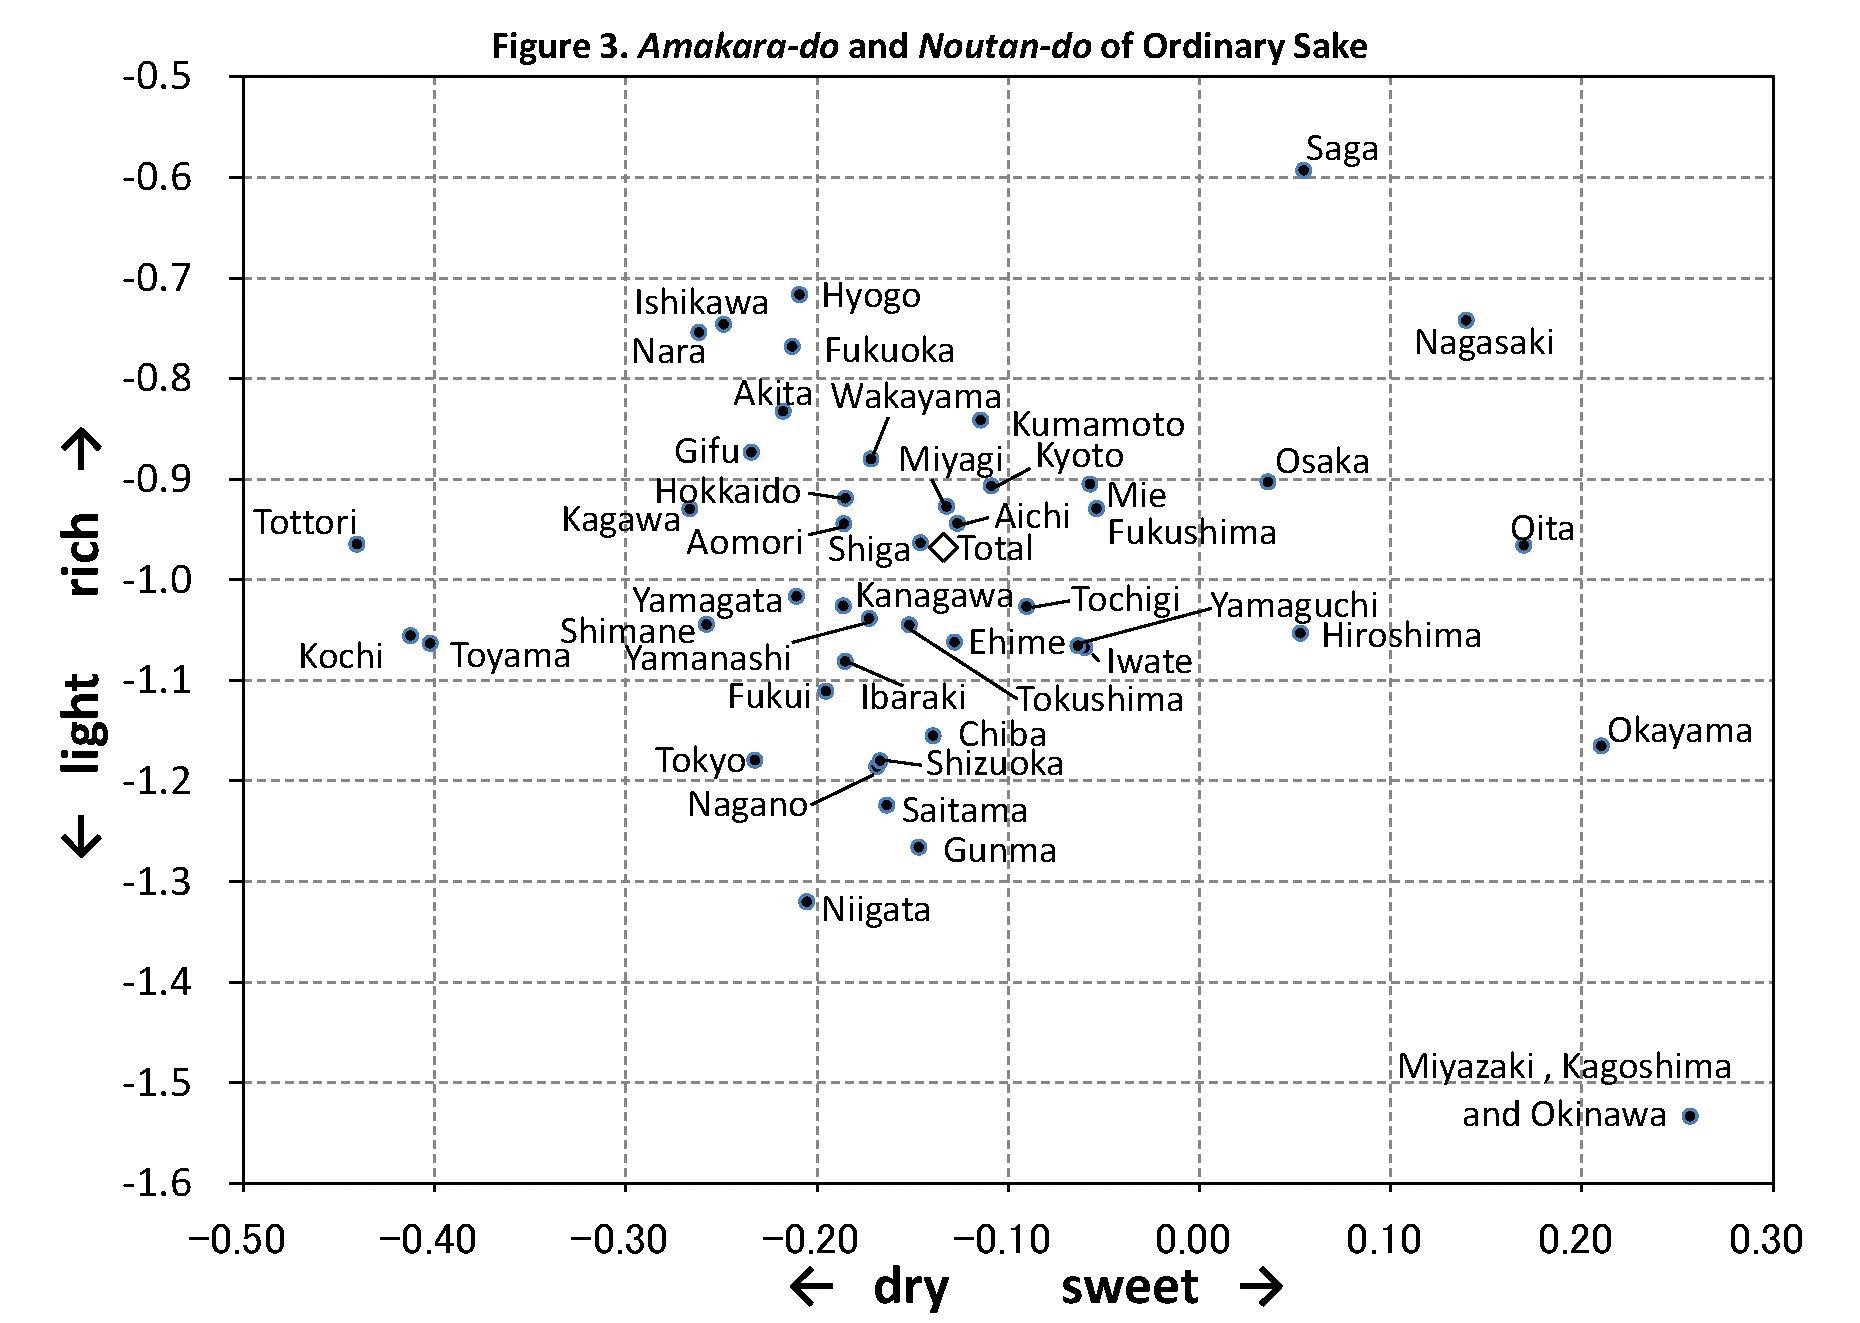
Amakara-do and Noutan-do are indexes calculated from Nihonshu-do and San-do. The higher the amakara-do is, the sweeter the sake tastes. Meanwhile, the higher the noutan-do is, the richer the sake tastes.
The average level of amakara-do is from -0.5 to -0.1, and the average level of noutan-do is from -1.0 to -0.4.
Specifically designated sake in general, junmai sake in particular, tends to have a drier and richer taste.
Aroma compounds
Ginjo sake has a fruity aroma which consists of esters such as isoamyl acetate (a banana-like flavor) and ethyl caproate (an apple-like flavor).
The average level of ethyl caproate is 2.1 mg/l and the average level of isoamyl acetate is 1.5 mg/l in ginjo sake.
Explanatory Notes
Tokutei-meishou, (specific designation):This is the classification system for sake as determined by the National Tax Agency. There are three categories below and combination of them.
- Ginjo sake:Made from highly polished rice, koji, water and jozo alcohol. Brewed using the ginjo-zukuri method. Has a characteristic flavor and high clarity.
- Junmai sake:Made simply from rice, koji and water. Good flavor and high clarity.
- Honjozo sake: Made from polished rice, koji, water and jozo alcohol. Good flavor and high clarity.
Ordinary sake: Sake other than specifically designated sake
The above are simplified descriptions. If you need more information, please refer to National Tax Agency Notice No.8, November 22, 1989 "Labelling Standards for the Manufacturing Process and Quality of Sake." (Japanese language only)
The average values of components are also calculated broken down by prefecture. (Table 2)
The distribution of amakara-do and noutan-do of sake has been visualized on a map. (Figure 1 and 2)
The profile of ordinary sake made in each prefecture has been plotted with amakara-do on the x-axis and noutan-do on the y-axis. (Figure 3)
| category | Ordinary sake | Ginjo | Junmai | Honjozo |
|---|---|---|---|---|
| Number of samples analysed | 2,231 | 2,070 | 2,017 | 1,901 |
| Alcohol content(%) | 15.39 | 15.91 | 15.46 | 15.54 |
| Nihonshu-do (sake meter value) | 3.8 | 4.4 | 4.1 | 5.1 |
| Ekisu-bun (extract) |
4.50 | 4.54 | 4.47 | 4.31 |
| San-do (acidity) |
1.18 | 1.32 | 1.49 | 1.27 |
| Aminosan-do (amino acid value) | 1.28 | 1.27 | 1.54 | 1.39 |
| Amakara-do | -0.13 | -0.34 | -0.52 | -0.35 |
| Noutan-do | -0.97 | -0.74 | -0.41 | -0.87 |
| Ethyl caproate (mg/l) | - | 2.11 | - | - |
| Isoamyl acetate(mg/l) | - | 1.49 | - | - |
| Number of samples | Alcohol content | Nihonshu-do | Ekisu-bun | San-do | Amino san-do | Amakara-do | Noutan-do | |
|---|---|---|---|---|---|---|---|---|
| Total | 2,231 | 15.39 | 3.8 | 4.50 | 1.18 | 1.28 | -0.13 | -0.97 |
| Hokkaido | 40 | 15.38 | 4.0 | 4.47 | 1.22 | 1.14 | -0.19 | -0.92 |
| Sapporo Region | 40 | 15.38 | 4.0 | 4.47 | 1.22 | 1.14 | -0.19 | -0.92 |
| Aomori | 31 | 15.36 | 4.1 | 4.46 | 1.20 | 1.48 | -0.19 | -0.94 |
| Iwate | 39 | 15.52 | 3.7 | 4.57 | 1.13 | 1.27 | -0.06 | -1.07 |
| Miyagi | 38 | 15.44 | 3.5 | 4.58 | 1.20 | 1.00 | -0.13 | -0.93 |
| Akita | 52 | 15.25 | 3.8 | 4.47 | 1.26 | 1.23 | -0.22 | -0.83 |
| Yamagata | 63 | 15.40 | 4.7 | 4.35 | 1.18 | 1.14 | -0.21 | -1.02 |
| Fukushima | 62 | 15.31 | 3.0 | 4.62 | 1.19 | 1.33 | -0.05 | -0.93 |
| Sendai Region | 285 | 15.37 | 3.8 | 4.50 | 1.19 | 1.23 | -0.14 | -0.95 |
| Ibaraki | 56 | 15.32 | 5.2 | 4.22 | 1.14 | 1.19 | -0.19 | -1.08 |
| Tochigi | 56 | 15.37 | 3.5 | 4.59 | 1.13 | 1.14 | -0.09 | -1.03 |
| Gunma | 43 | 15.22 | 5.4 | 4.17 | 1.06 | 1.08 | -0.15 | -1.27 |
| Saitama | 53 | 15.25 | 5.3 | 4.22 | 1.09 | 1.14 | -0.16 | -1.22 |
| Niigata | 108 | 15.51 | 5.9 | 4.14 | 1.05 | 1.12 | -0.21 | -1.32 |
| Nagano | 113 | 15.18 | 5.0 | 4.25 | 1.10 | 1.00 | -0.17 | -1.19 |
| Kanto-Shinetu Region | 429 | 15.32 | 5.1 | 4.25 | 1.10 | 1.10 | -0.17 | -1.19 |
| Chiba | 51 | 15.24 | 4.7 | 4.30 | 1.11 | 1.14 | -0.14 | -1.16 |
| Tokyo | 23 | 15.54 | 5.7 | 4.22 | 1.12 | 1.16 | -0.23 | -1.18 |
| Kanagawa | 26 | 15.40 | 4.5 | 4.38 | 1.17 | 1.32 | -0.19 | -1.03 |
| Yamanashi | 31 | 14.90 | 4.5 | 4.24 | 1.18 | 1.29 | -0.17 | -1.04 |
| Tokyo Region | 131 | 15.25 | 4.8 | 4.29 | 1.14 | 1.21 | -0.17 | -1.11 |
| Toyama | 29 | 15.06 | 6.5 | 3.91 | 1.20 | 1.09 | -0.40 | -1.06 |
| Ishikawa | 43 | 14.91 | 3.6 | 4.36 | 1.30 | 1.36 | -0.25 | -0.75 |
| Fukui | 41 | 15.33 | 5.0 | 4.26 | 1.14 | 1.34 | -0.20 | -1.11 |
| Kanazawa Region | 113 | 15.10 | 4.9 | 4.21 | 1.21 | 1.28 | -0.27 | -0.96 |
| Gifu | 71 | 15.55 | 4.2 | 4.47 | 1.24 | 1.49 | -0.23 | -0.87 |
| Shizuoka | 32 | 15.71 | 5.2 | 4.34 | 1.11 | 1.45 | -0.17 | -1.18 |
| Aichi | 54 | 15.33 | 3.6 | 4.51 | 1.19 | 1.44 | -0.13 | -0.94 |
| Mie | 48 | 15.33 | 2.8 | 4.66 | 1.19 | 1.31 | -0.06 | -0.90 |
| Nagoya Region | 205 | 15.46 | 3.8 | 4.51 | 1.20 | 1.43 | -0.15 | -0.95 |
| Shiga | 73 | 15.71 | 3.9 | 4.64 | 1.19 | 1.41 | -0.15 | -0.96 |
| Kyoto | 57 | 15.39 | 3.3 | 4.64 | 1.20 | 1.21 | -0.11 | -0.91 |
| Osaka | 29 | 15.83 | 2.1 | 4.99 | 1.18 | 1.17 | 0.04 | -0.90 |
| Hyogo | 117 | 15.47 | 3.2 | 4.69 | 1.30 | 1.26 | -0.21 | -0.72 |
| Nara | 54 | 15.74 | 3.8 | 4.69 | 1.30 | 1.49 | -0.26 | -0.75 |
| Wakayama | 45 | 15.47 | 3.7 | 4.58 | 1.22 | 1.21 | -0.17 | -0.88 |
| Osaka Region | 375 | 15.57 | 3.4 | 4.68 | 1.24 | 1.30 | -0.17 | -0.83 |
| Tottori | 35 | 15.61 | 6.4 | 4.10 | 1.25 | 1.47 | -0.44 | -0.96 |
| Shimane | 43 | 15.64 | 5.2 | 4.31 | 1.18 | 1.44 | -0.26 | -1.04 |
| Okayama | 59 | 15.09 | 1.9 | 4.77 | 1.03 | 1.13 | 0.21 | -1.17 |
| Hiroshima | 62 | 15.39 | 2.7 | 4.69 | 1.11 | 1.20 | 0.05 | -1.05 |
| Yamaguchi | 52 | 15.67 | 3.8 | 4.56 | 1.13 | 1.35 | -0.06 | -1.07 |
| Hiroshima Region | 251 | 15.45 | 3.7 | 4.53 | 1.13 | 1.29 | -0.06 | -1.07 |
| Tokushima | 42 | 15.30 | 4.3 | 4.37 | 1.15 | 1.16 | -0.15 | -1.04 |
| Kagawa | 21 | 15.44 | 5.2 | 4.30 | 1.19 | 1.32 | -0.27 | -0.93 |
| Ehime | 54 | 15.48 | 4.2 | 4.46 | 1.14 | 1.29 | -0.13 | -1.06 |
| Kochi | 32 | 15.19 | 6.5 | 3.96 | 1.21 | 1.24 | -0.41 | -1.06 |
| Takamatsu Region | 149 | 15.36 | 4.9 | 4.31 | 1.17 | 1.25 | -0.22 | -1.04 |
| Fukuoka | 83 | 15.34 | 3.4 | 4.57 | 1.28 | 1.57 | -0.21 | -0.77 |
| Saga | 54 | 15.34 | 0.3 | 5.11 | 1.30 | 1.38 | 0.05 | -0.59 |
| Nagasaki | 42 | 15.12 | 0.4 | 5.04 | 1.22 | 1.42 | 0.14 | -0.74 |
| Fukuoka Region | 179 | 15.29 | 1.8 | 4.84 | 1.27 | 1.48 | -0.05 | -0.71 |
| Kumamoto | 23 | 15.29 | 3.0 | 4.62 | 1.23 | 1.37 | -0.11 | -0.84 |
| Oita | 47 | 15.43 | 1.2 | 4.96 | 1.14 | 1.35 | 0.17 | -0.97 |
| Miyazaki, Kagoshima and Okinawa | 4 | 14.55 | 3.3 | 4.35 | 0.88 | 1.45 | 0.26 | -1.53 |
| Kumamoto and Okinawa Region | 74 | 15.34 | 1.9 | 4.82 | 1.15 | 1.36 | 0.09 | -0.96 |
Figure 1 Amakara-do Map

Figure 2 Noutan-do Map

Figure 3 Amakara-do and Noutan-do of Ordinary Sake
